Intro to Taxonomy Development Tools
Background
Much cell type/class annotation consists simply of names attached to individual cells in a cell-by-gene-matrix. Within the Brain Initiative, it has become standard to extend this simple annotation by associating it with additional information including: hierarchical relationships between annotations; synonyms; annotation provenance (who annotated what); supporting references; annotation transfer from other taxonomies; marker genes; and cell type location, based on dissection and spatial transcriptomics (e.g. MerFish).
Extended annotations have been published as standardized "taxonomies" following the common cell type nomenclature standard (Miller et al. 2020) and as unstandardised supplementary material {add figure showing examples with refs}. These are published separately from the cell-by-gene-matrices to which they refer, with the only link between the two being the cell type/class name used in annotation (sometimes supplemented by a file mapping cluster to cell IDs). These links break easily (if names are changed) and without a standard for versioning, taxonomies published in papers often do not completely match cell-by-gene-matrices for the same paper published on portals like CZ CELLxGENE. It is also difficult for the community to make use of these taxonomy documents in combination with matrix files.
A typical workflow within BICAN starts from an agreed set of clusters. Hierarchical annotations (taxonomies) are built on top of these clusters by combining them to form a hierarchy of nested cell sets with a fixed number of levels (see figure {hierarchical annotation}).
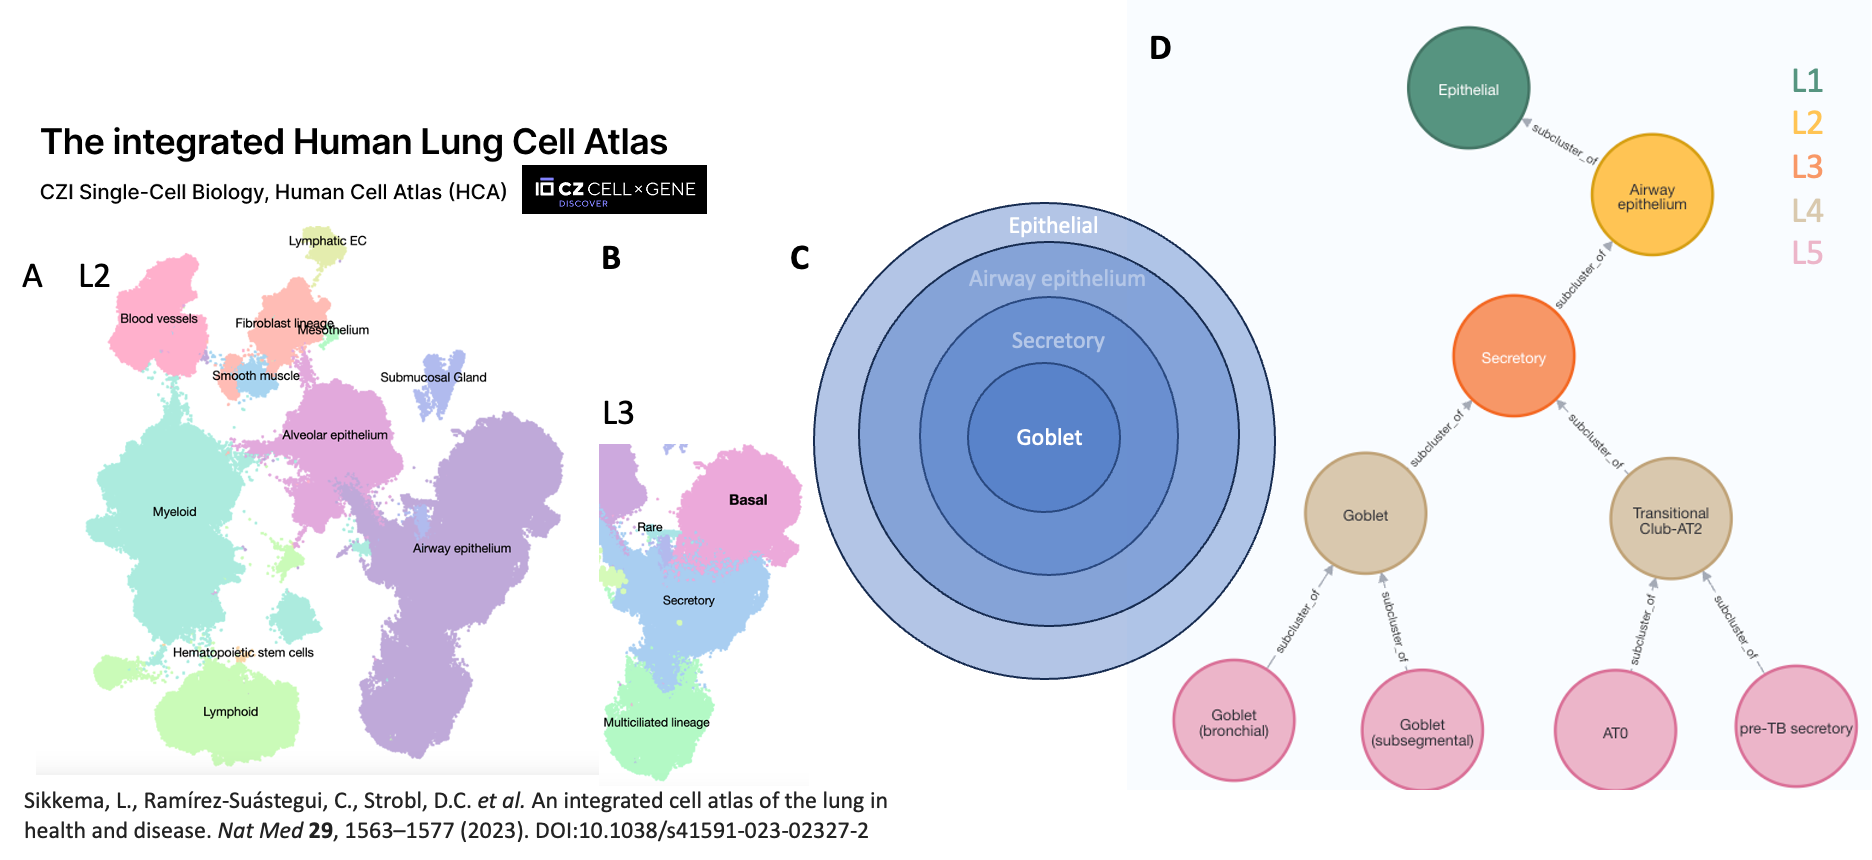
Figure {hierarchical annotation}: Hierarchical annotation on an
Integrated Human Lung Cell Atlas. Panels A and B show annotation
at Levels 2 and 3 of the hierarchy. L2 annotation Airway epithelium
encompasses L3 annotations, Basal, secretory and Mucilated lineage.
C shows the nested relationship between cell sets in this
hierarchy - all cells in the Goblet cell set are in the secretory cell
set which are all in the Airway epithelium cell set etc. This can be
represented as a simple graph or tree as shown in Panel D - where
each cell set has only one parent.
These extended annotations are typically developed using informally structured spreadsheets, separate from the data being annotated in cell-by-gene-matrices. This overcomes the typical limitations of cell-by-gene-matrix formats like AnnData, which don't easily support anything more than associating names with individual cells. In spreadsheets, we can record annotations on a smaller number of sets of cells (clusters and combinations of clusters), associating an annotation with a rich context of additional information. Spreadsheets are easy to share and edit, especially if developed on an online platform that can reconcile concurrent edits (e.g. Google Sheets or Microsoft Sharepoint). They can also easily be exported to and from CSV, supporting easy conversion to DataFrames for programmatic population of content.
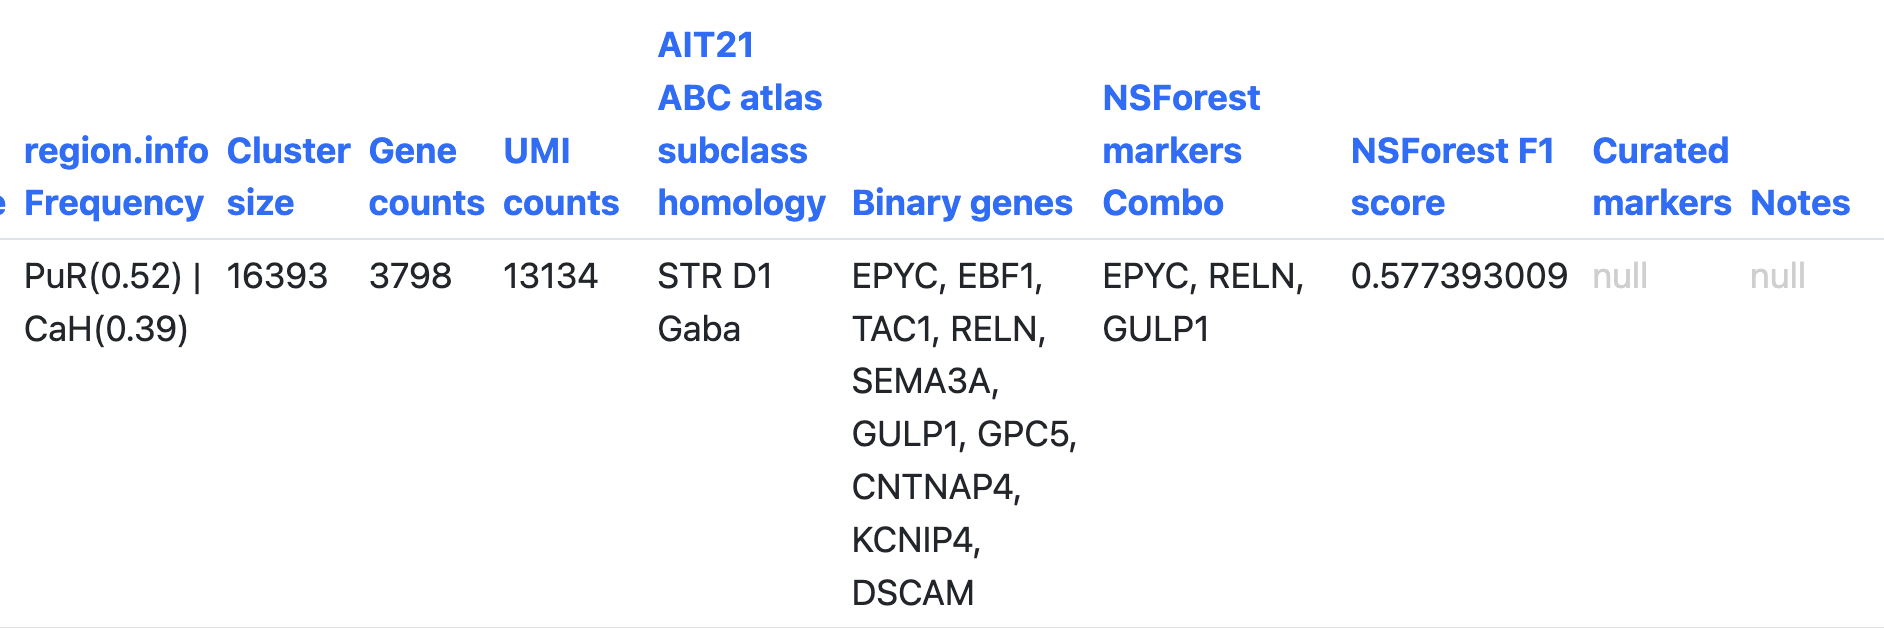
By convention these spreadsheets are structured with one row per cluster. Additional columns record membership of the cluster higher level cell sets and metadata about clusters (see figure {informal_taxonomy})
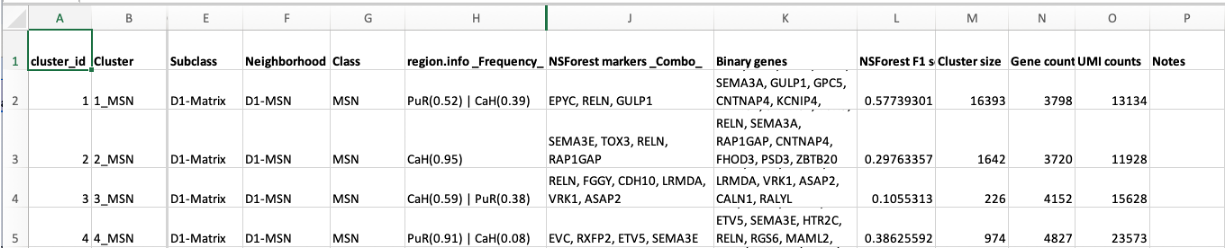
Figure: {Informal Taxonomy} A fragment of an informal taxonomy
spreadsheet used to annotate a cell-by-gene-matrix of cells from the
basal ganglion. The first 2 columns contain the IDs and names of
clusters. The next three columns assign these clusters to progressively
larger cell set groupings: SubClass, Neighbourhood and Class. These
become the names of labelsets in CAS/TDT. The proceeding rows record
additional metadata about clusters including location based on
dissection, markers, cluster size etc. One disadvantage of this approach
is that there is no way to record additional metadata about cell sets
above the cluster level.
This informal method is not without challenges. The connection between these spreadsheets and matrices relies on cluster IDs or cell type/class names. Researchers use ad hoc methods for synchronizing the two, often involving an additional cluster- to-cell-ID mapping file. The structure of the file also does not allow for adding metadata about cell sets above the cluster level.
Taxonomy Development Tools
We have developed an updated standard for representing taxonomies (Cell Annotation Schema (CAS) {ref}), a graphical editor (Taxonomy Development Tools (TDT)) and a system for publishing, versioning and sharing taxonomies. Importantly, this system tightly integrates taxonomies with cell-by-gene-matrices in AnnData (h5ad) format. The schema, which was developed to support the broader community annotating cell-by-gene matrices, contains a slot for linking to an AnnData file. TDT can use this to check the associated AnnData file is in-sync with the taxonomy, warning about any problems. It can also update the AnnData file when a taxonomy changes. Another important feature is that this is an open standard: it allows authors to define and edit any additional fields that they need on top of the fields standards by CAS (figure).
TDT takes the typical informal taxonomy spreadsheets used within BICAN as input, and with some minimal configuration, converts them into a CAS compliant representation and checks this for consistency with a linked AnnData file. Configuration includes specification of which columns represent levels in the hierarchy and what level (or rank) they represent. The name of each of these columns defines a set of annotations called a labelset. Taxonomy_labelsets table in TDT supports recording additional metadata about each labelset.
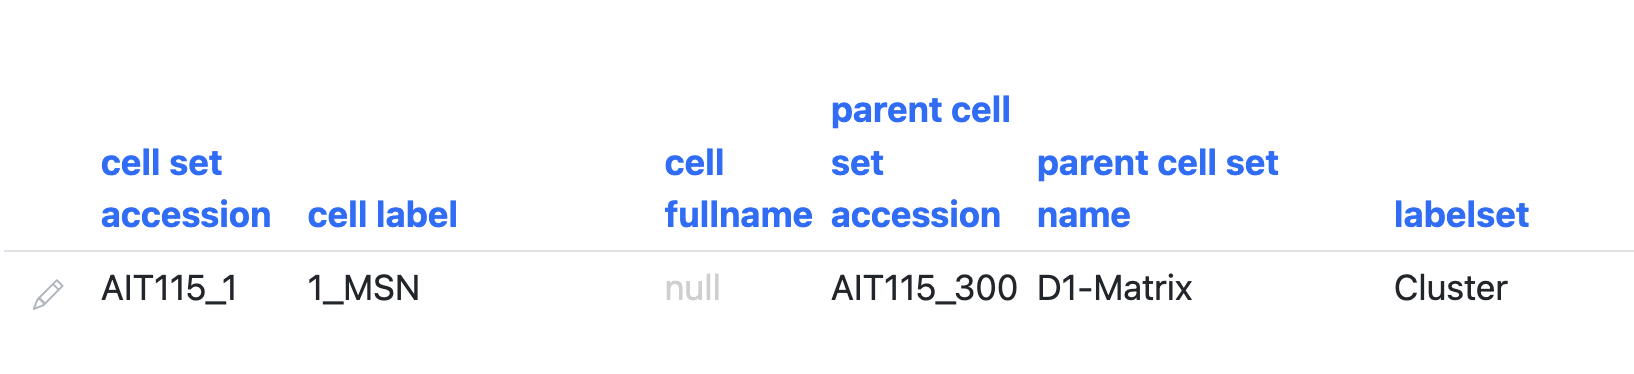
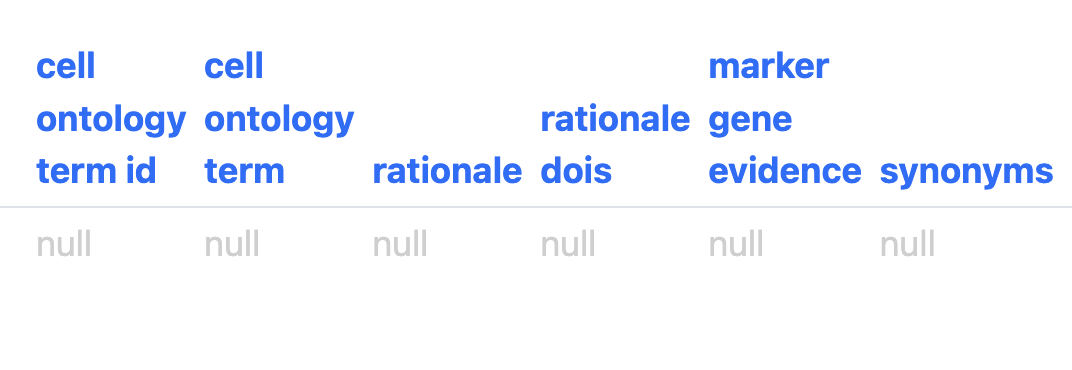
Annotations are represented in a taxonomy_annotations table with one row per cell set (clusters and higher level groupings), allowing metadata to be recorded for all levels . Each row has both CAS standard columns and user-defined columns taken from the original spreadsheet (figure {annotation_table C}) . The CAS standard supports taxonomy hierarchy via specifying parent cell-set (figure {annotation_table A}). An accompanying taxonomy tree view allows users to visualise this hierarchy (figure {annotation_table D}). Other CAS columns include slots for cell ontology terms mappings, synonyms, marker gene evidence, comments and supporting references (figure {annotation_table B}). Editing support includes pick-lists and autocomplete for fields including labelset, parent cell set and cell ontology term. In future, CAS and TDT will expand to include additional fields that are now only supported in user defined fields.
A
B
C
D
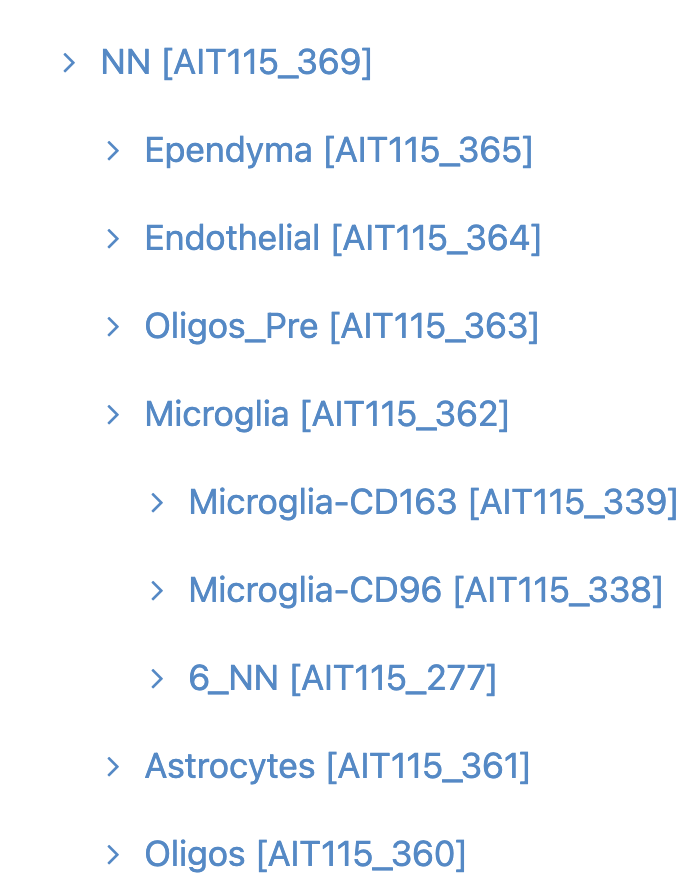
Figure {annotation_table}: A* Core CAS fields: accession (ID),
label, hierarchy. B Additional CAS fields allow linking to cell
ontology terms, recording marker gene evidence, synonyms, and
references. C User defined fields from the original spreadsheet
{shown in figure {Informal Taxonomy}. D* Visualization of taxonomy
hierarchy as a tree.
TDT uses GitHub to support concurrent editing by multiple users and to control access. It does this in a way that insulates users from GitHub, with a simple system for saving and publishing. All that is required of users is that they register an account with GitHub and provide their GitHub username, the email account they used to register and an access token which they can request from GitHub. Saving automatically shares edits with other editors. Publishing generates a named version that can be shared via a simple URL. This allows for tracking of versions used in analysis. The visibility of shared and published taxonomies is controlled via access to the GitHub repo. During development of a taxonomy, we limit this to a group of editors. Once the project is ready to share with the world, the GitHub repo can be made public, allowing anyone with the URL to access it.